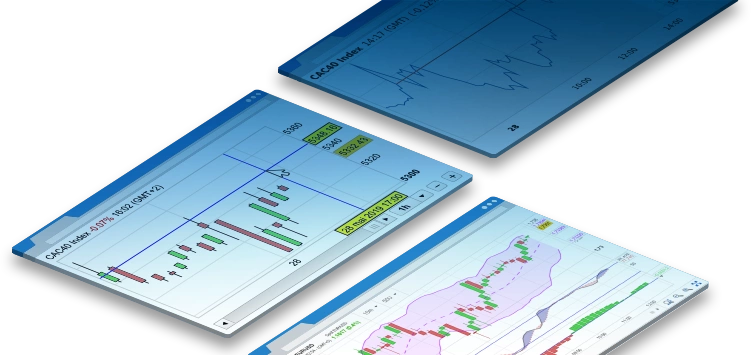
Intuitive and customisable charting solutions for financial websites or trading platforms
Charting solutions
 Easy and fast implementation
Adding our charts to a website can be done very simply by calling a URL.
If you have a trading platform, the charts can be integrated so they appear to be part of your trading platform.
 High quality market data
We can provide official market data for our charting solutions or integrate your proprietary data for instruments such as Forex or CFDs. The datafeed can be provided in real-time (push or streaming), delayed, or end-of-day.
 Customisation
All of our charting solutions may be branded with your logo and customized to fit your website or trading platform. They are perfect tools for online charting and can also be used in desktop trading applications.
 Historical data management
We provide you with historical data in the charts so you do not need to manage it yourself. This service can also include generation of historical data in the charts for your proprietary instruments.
Compare our charting solutions
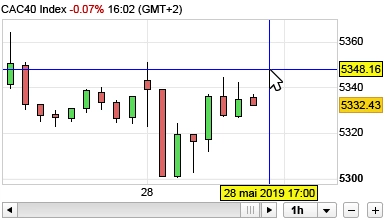
ITCharts Static
Static chart
Static chart for instant display. Ideal for corporate homepages and investor relations websites.
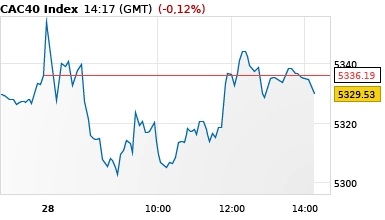
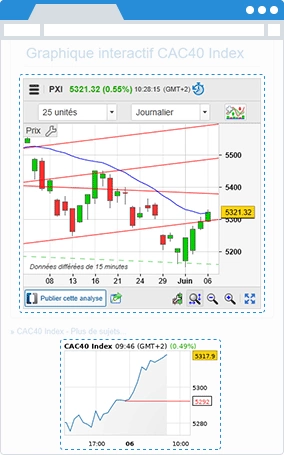
ITCharts Dynamic
Interactive chart
Interactive chart with optimized low bandwidth usage and fast display. Ideal for banking websites, corporate homepages and investor relations websites.
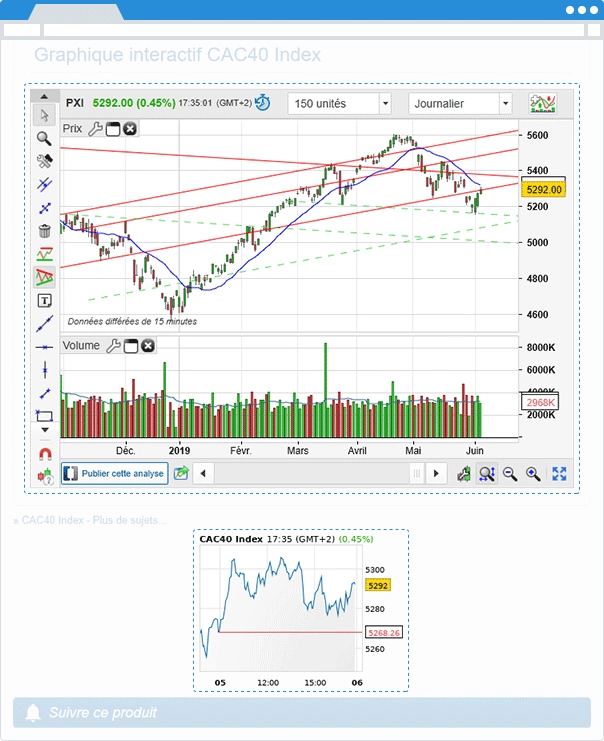
ITCharts Full Dynamic
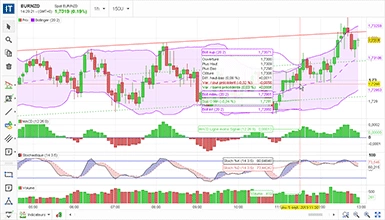
Interactive chart with analysis tools
Interactive chart with a wide range of indicators and drawing tools to satisfy all types of investors. Ideal for banking and financial websites and brokers wishing to improve their web trading platform.
ITCharts Static
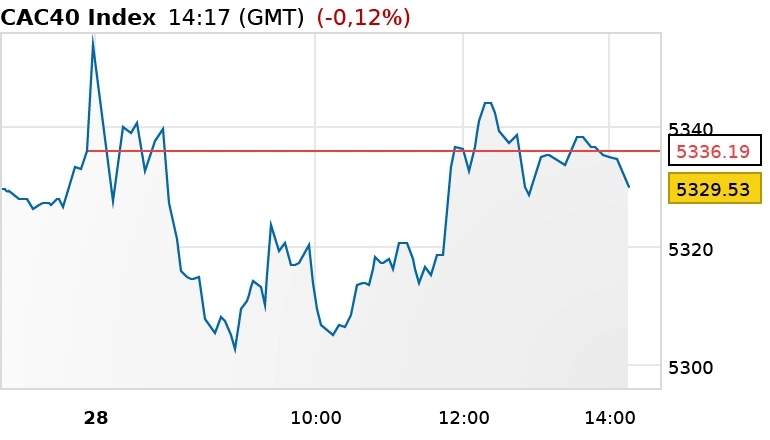
Static chart
Static chart for instant display. Ideal for corporate homepages and investor relations websites.
ITCharts Dynamic
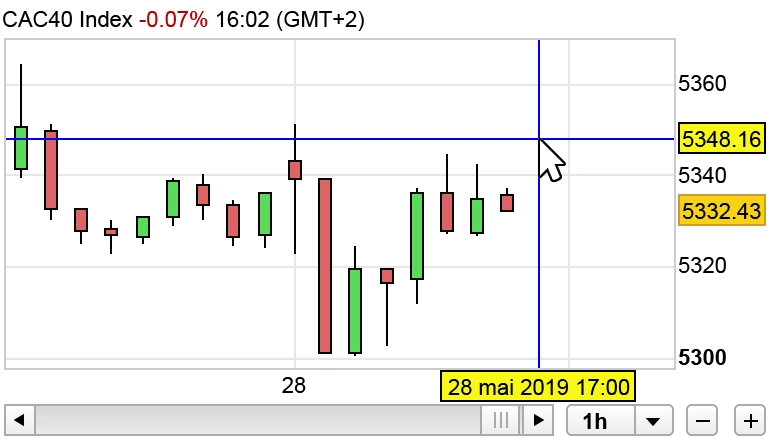
Interactive chart
Interactive chart with optimized low bandwidth usage and fast display. Ideal for banking websites, corporate homepages and investor relations websites.
ITCharts Full Dynamic
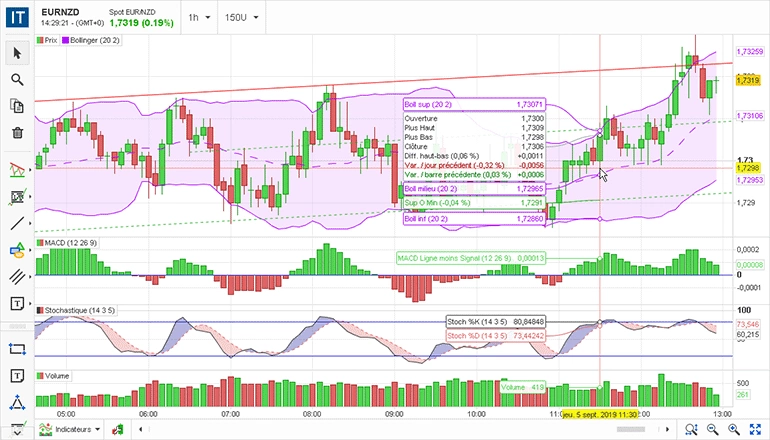
Interactive chart with analysis tools
Interactive chart with a wide range of indicators and drawing tools to satisfy all types of investors. Ideal for banking and financial websites and brokers wishing to improve their web trading platform.
| STATIC | DYNAMIC | FULL DYNAMIC | |||
|---|---|---|---|---|---|
| Technology | |||||
| STATIC | DYNAMIC | FULL DYNAMIC | |||
| PNG image | - | - | |||
| - | - | ||||
| HTML5 / JS | - | ||||
| - | |||||
| Compatible Windows / Mac / Linux | |||||
| Compatible Mobile & Tablet devices | |||||
| Standard features | |||||
| Personalization with your look & feel | |||||
| Available in multiple languages | |||||
| Optimized charting engine - quick chart movement and zoom | - | ||||
| - | |||||
| Resizable charts with full screen mode | - | ||||
| - | |||||
| Standard time periods: 1, 5, 10, 15, 30, 60min, Day, Week, Month | |||||
| Charting views: Candlestick, Bar, Line, Mountain | |||||
| Technical analysis indicators | 2 | 27 | 32 | ||
| 2 | 27 | 32 | |||
| Standard analysis objects: trend lines, figures, texts, fibonacci | - | - | 20 | ||
| - | - | 20 | |||
| Advanced features | |||||
| Automatic support & resistance lines | - | ||||
| - | |||||
| Advanced Time periods: Tick, Second, (x)minutes, (x)hours, (x) days | - | - | |||
| - | - | ||||
| Comparison of multiple securities on the same chart | - | - | |||
| - | - | ||||
| Logarithmic and Relative % chart scales | - | - | |||
| - | - | ||||
| Advanced analysis objects : Andrew’s pitchfork, Gann fan & square | - | - | |||
| - | - | ||||
| Data | |||||
| Datafeed for regulated markets provided by IT-Finance | |||||
| Low latency datafeeds: tick by tick in push mode | - | ||||
| - | |||||
| Historical data provided by IT-Finance | |||||
| Integration of your proprietary datafeeds (Forex, CFDs) | |||||
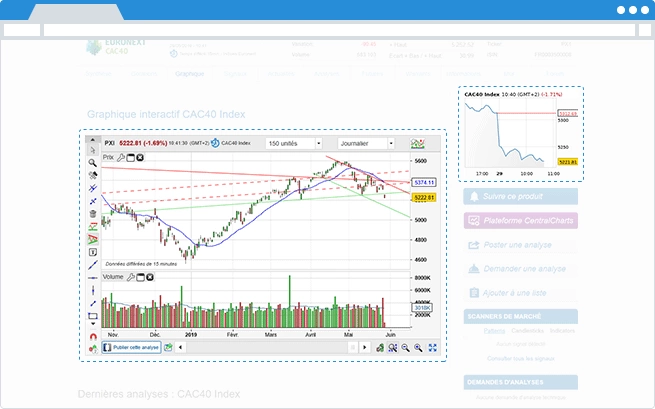
Integration example
The CentralCharts website is a financial portal and social network that allows investors to create market analysis and share them with others.
IT-Finance provides them with a range of charting solutions starting from static charts to dynamic charts with analysis tools. Besides IT-Finance provides them the market data and historical data displayed on their website.
You will be redirected to www.centralcharts.com
